A larger tool catalog can raise an agent's aggregate pass rate while its performance on earlier tasks declines. EvoHarnessBench v3 reports both results for its deployment baselines. The apparent contradiction disappears once the comparisons are separated: one compares tool-exposure conditions; the other follows old tasks across harness stages. Tool results, Table 2 and Figure 3
The same tasks, a larger surrounding harness
Here, the harness is the capability pool through which an agent acts: tools, reusable procedural skills or specialist agents. EvoHarnessBench expands these axes separately. Capabilities are added cumulatively, with frequently required ones released earlier. Once introduced, they are never removed or modified; old task inputs and verifier-checkable targets also remain unchanged. The harness stays fixed during execution within each stage. This construction makes it possible to revisit the same tasks as the surrounding pool grows. Construction, §§3.1–3.3
The diagram below illustrates the metric definitions with three stages, H1–H3, and three task cohorts, C1–C3. A cohort groups tasks introduced at the same stage. These are teaching labels, not a measured experimental stream. The cells contain no scores. Positions marked “not yet introduced” are unavailable evaluations, not zero performance.
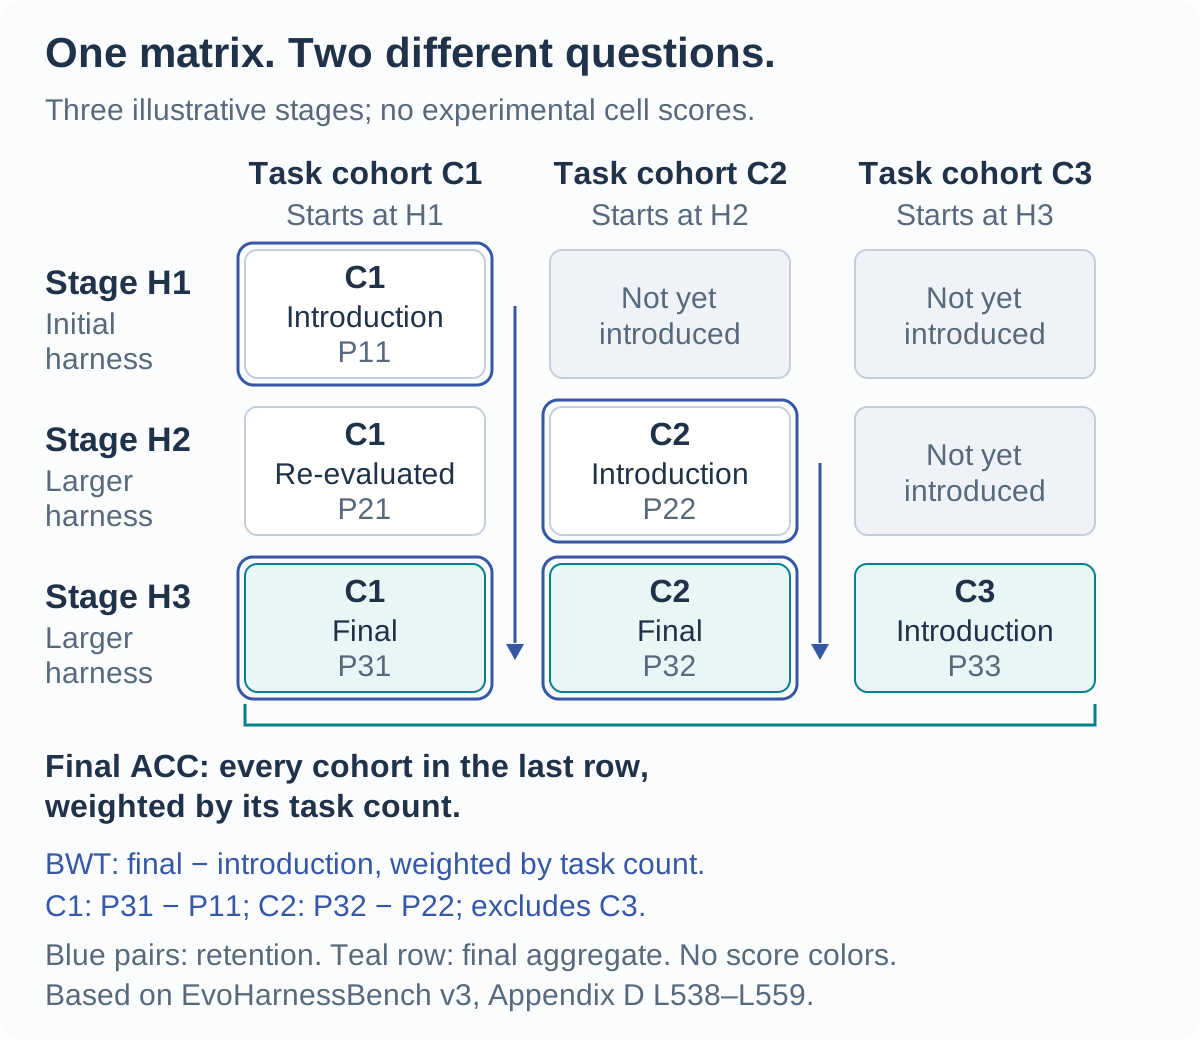
Each cell's first index identifies the stage and its second index identifies the cohort. P31, for example, is C1's performance under H3. Following one column therefore keeps the tasks constant while changing the harness stage. Performance matrix, Appendix D
BWT pairs old cells; ACC combines the final row
For C1, backward transfer, BWT, compares its final evaluation, P31, with its introduction evaluation, P11. C2 contributes P32 − P22. C3 contributes no BWT pair: it first appears at the final stage, so there is no earlier-stage evaluation against which to measure retention.
If n1 and n2 are the old cohorts' evaluation-task counts, the schematic specializes Appendix D's definition to:
BWT = [n1 × (P31 − P11) + n2 × (P32 − P22)] / (n1 + n2)
The blue outlines identify those endpoint pairs. Negative BWT means old-cohort performance declined on this weighted average. It does not mean every old task declined; conversely, a nonnegative average can contain individual regressions. BWT definition, Appendix D
Final ACC takes a different set of cells: P31, P32 and P33, the entire teal row. With n3 denoting C3's evaluation-task count:
ACC = [n1 × P31 + n2 × P32 + n3 × P33] / (n1 + n2 + n3)
ACC includes the final new cohort and subtracts no introduction baseline. The equally sized cells do not give cohorts equal weight: both formulas use task counts, but their denominators cover different cohorts. Color identifies the comparison, not whether a score rose or fell. Final ACC and matrix definitions, Appendix D
This is why a final aggregate cannot establish retention. A level of performance across the last row does not reveal how each old column changed. Nor does the diagram identify which later tasks account for an aggregate gain; that requires the corresponding cohort data.
The tool results use EnterpriseOps-Gym, shortened to EOG, and Agents' Last Exam, shortened to ALE. Table 2 fixes GPT-5, with ReAct on EOG and Codex on ALE. Pass rate counts tasks whose verifier reports successful completion. Its reference condition gives each task only its annotated required tools; the cumulative condition exposes the full catalog available at the corresponding stage. Benchmark instances and evaluation definitions, §§3.1 and 3.4, Table 2
| System and environment |
Pass rate: task-specific → cumulative tools |
Reported operating tokens: task-specific → cumulative tools |
| ReAct, EOG |
26.0% → 30.2% |
27.2M → 75.8M |
| Codex, ALE |
11.6% → 12.2% |
82.2M → 100.8M |
These arrows compare two exposure conditions. They are not the blue introduction-to-final arrows in the diagram: 26.0% and 30.2% cannot be inserted as P11 and P31. Table 2's aggregate values do not supply those cohort measurements.
The broader catalog improves the reported pass-rate point values and increases operating-token totals in both comparisons. M means million. These totals are not policy-token budgets per trial, monetary costs or the complete research bill; token growth alone does not establish longer execution time.
The authors separately report negative deployment BWT for ReAct on EOG and Codex on ALE. Deployment mode starts a fresh system at every stage, carrying no persistent state across stages. Model parameters and prompting remain fixed; the exposed capability pool changes. “Forgetting” here describes degraded old-task performance under that expanded pool. It does not require altered weights or lost cross-stage memory. Deployment controls and transfer observations, §§3.4 and 4.1
The result also has a counterexample within the paper. EOG's multi-agent tool setting shows little forgetting, and no-memory AutoGen has positive BWT. The authors caution that stability alone can flatter a weaker system that acquires less new competence. Retention therefore needs to be read alongside what the system can do and how it adapts. Multi-agent retention, Appendix I.2
A separate EOG specialist-agent analysis makes the behavioral change more concrete: forgotten tasks more often stop invoking specialists involved in earlier successful executions. The main observation is lost delegation coverage, rather than increased delegation to newly introduced irrelevant agents. It illustrates one setting's execution failure; it does not establish the cause of every tool, skill or agent regression. Delegation drift, Figure 8
Experience adds another comparison
Adaptation mode carries persistent state across stages. The system can update memories, procedures, textual instructions or routing policies using cumulative adaptation tasks before evaluation on reserved tasks. Model weights remain fixed in this study. The external capability pool and the accumulated state are separate parts of the protocol. Adaptation scope and protocol, §§1 and 3.4
MemToolAgent converts relevant actions, environmental feedback and outcomes into retrievable procedural reflections. Its reported EOG pass rate is 38.6%, above the cumulative deployment baseline's 30.2%; on ALE it is 10.1%, below the baseline's 12.2%. The same memory method's benefit does not carry uniformly across these environments. Memory representation, Appendix G.1, Table 2
Table 3 then holds the EOG task stream and cumulative evaluation harness fixed while changing the tools available during MemToolAgent adaptation. That distinction matters: all three conditions face the cumulative catalog when evaluated. Adaptation-context controls, Table 3
| Tools available during MemToolAgent adaptation |
Pass rate under cumulative evaluation |
Reported adaptation time |
| Stage-wise cumulative pool |
38.6% |
23.9 hours |
| Each task's annotated required tools |
39.1% |
17.9 hours |
| Final tool pool at every adaptation stage |
37.9% |
28.6 hours |
The task-specific condition reports less adaptation time with a similar pass rate. It receives hidden required-tool annotations, however; the comparison does not demonstrate automatic runtime filtering or establish statistical superiority. Nor does it identify a universally best exposure policy. On the skill axis, the paper's keyword-based task associations are explicitly heuristic and do not guarantee necessity, sufficiency or uniqueness. The annotation conditions are part of what these controls can establish. Annotation scope, §3.3, Table 3 interpretation
Even useful accumulated experience does not collapse adaptation and retention into one outcome. Forward transfer, FWT, compares a new cohort before and after the current stage's adaptation, under the same harness. It weights those differences by task count over stages after the first. In the reported tool-transfer summaries, GEPA and Meta-Harness have positive BWT but negative FWT on ALE. Better retention of earlier cohorts can coexist with worse adaptation to new ones. FWT definition, Appendix D, Transfer results, Figure 3
For discussions of recursive self-improvement, the bounded lesson is to keep these comparisons visible: final aggregate performance, change on old cohorts, and adaptation to new cohorts each need evidence. EvoHarnessBench's externally supplied capability growth and fixed-weight state updates do not establish a general recursively improving process or a universal RSI scale. A larger final score leaves the old columns unanswered. Study scope and metrics
This analysis is dated 14 October 2026 and discusses v3, revised on 26 September; v1 was submitted on 3 September. Those version dates do not establish experiment dates or the exact v3 change list. Results are the authors' reports; this article presents no independent replication results. Version history